Руководство по графу анимаций/Визуальная отладка
Материал из CryWiki Russia
Версия от 16:05, 23 мая 2011; DCamer (Обсуждение | вклад)
What is visual debugging?
- You can think of it as a visual version of the 'ag_debug' console command.
- Instead of outputing bunch of texts to the viewport, it displays the run-time data on the top of the animation graph editor.
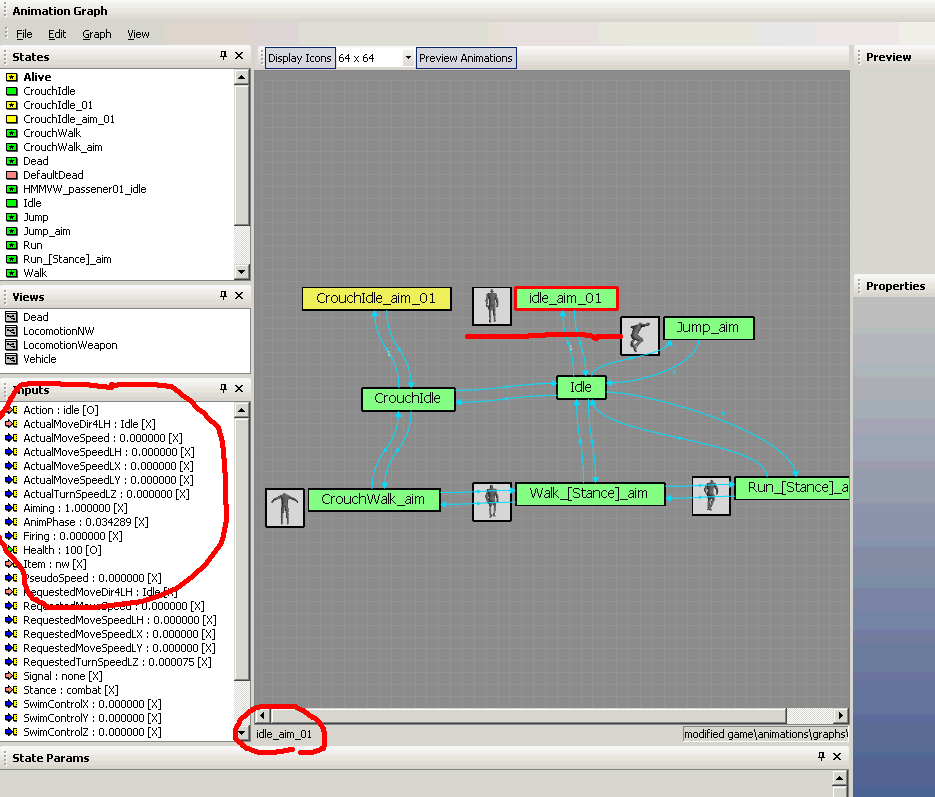
- It's useful to check what state is currently active and what input values led to it.
Example outcome
- The current state is hightlighted with a red boundary and also specified in the status bar.
- 'Inputs' panel shows current input values and matching status(whether an input is matching to a corresponding selection criterion of the state).
- If the current state is not in the active view, it is automatically switched to a view containing that state.
How to use it
- You use the console command, 'ag_debugVisual'. Its usage is same as that of 'ag_debug'.
- ag_debugVisual 1 : turn on for the player character
- ag_debugVisual 0 : turn off
- ag_debugVisual _entity_ : turn on for the _entity_
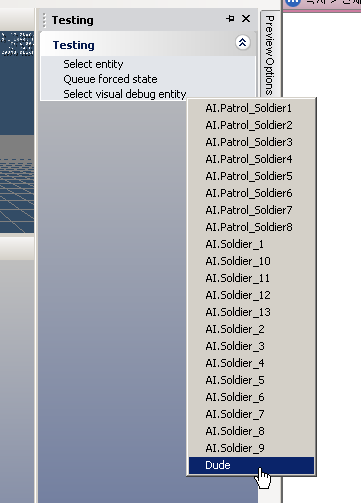
- You also can use the 'Testing' pane of the animation graph editor.

